
It might help to remember that Insulin Therapy AnalysisTM is endorsed and used by a current member of the Board of Directors of the AADE, Dr. Richard Guthrie, MD, CDE. Dr. Guthrie is one of the principal authors of the AADE's "bible" on Diabetes Education: A Core Curriculum for Diabetes Educators. Diabetes Online is extremely proud of such this powerful endorsement.
| If graphs and plots are intimidating for you, remember: | |
| You can easily drive your car without knowing details about how its engine works. | |
| You can easily drive ITA without knowing details about how its "engine" works. | |
| .... But many people will want to see this! | |
| So here we go... |
First, a few warnings:
Do not mistake these results for your regime!
Remember, you are looking "under the hood" to see how ITA handles Kenneth M's personal regime.
If you see things that you think might apply to you, GO SEE YOUR DOCTOR!
| So here we go... |
For your convenience, here is Ken M's real life regime as he submitted it.
| Regime | Client's own description |
|---|---|
|
|
| Now here is MORE of the ITA picture.... |
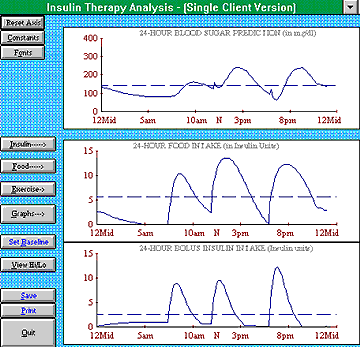
Below is the ITA computer screen of KenM's regime. (This is exactly what you would see on your own computer when you click on the Graphs button).
 |
This top plot shows simulated blood glucose levels (figure 1a)
This middle plot shows: Carb Loading
(figure 2a) This bottom graph shows: Available Insulin (bolus) (figure 3a) |
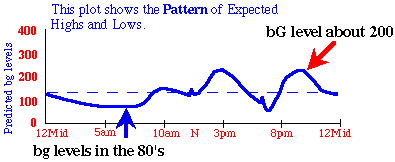
The top plot (figure 1a) is often the most important graphic: It's where YOU would see YOUR expected blood sugar levels if you had typed in YOUR food and insulin.
Then I took that very important top plot, and prettied it up so I could highlight some of the important things that ITA is communicating. Please, compare FIGURE 1A (below) with figure 1a (above) with , you'll see it is exactly that same figure 1a.
| This is what medicine expects should happen, based on Ken M's real life food/insulin regime. | |
 |
|
| FIGURE 1A: This is KenM's predicted blood sugars (annotated). | |
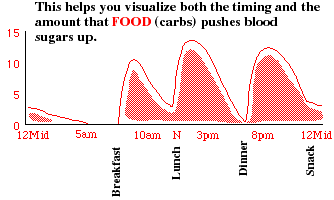
This, the middle plot from above (figure 2a), shows CARB LOADING:
 |
||
| FIGURE 2A (above), annotated for emphasis and clarity, shows carb loading. | ||
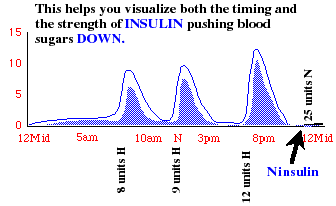
| And FIGURE 3A (below) shows available insulin. (bolus) | ||
 |
| |
| Figure 3A, available insulin, annotated for emphasis and clarity. | ||
| This *feels right*: It even clearly shows how KenM's overlapping insulins compare with coverage for his carbohydrates. This shows him ok in the morning, with wider fluctuation in the afternoons. |
|
|
|
|
|
|
|
|
|
|
|
|
Yes, with ITA, you can do a "what if" analysis on your computer.
Sorry, but I've chosen NOT to investigate possible improvements to KenM's IDDM regime.
The primary reason revolves around the fact that his existing regime involves a LOT of Humalog, far more than a physician or Lilly would probably recommend.
The following information highlights this "insensitivity" issue:
Looking again at KenM's expected bG levels:
|
"in the Groove" |
| Look at the text which shows a very low (15 mg/dl) sensitivity to Insulin. | |
When I say that KenM is probably "in the groove", I mean that KenM's "body" is probably providing a lot more "dampening" than one could expect from this insulin/food regime. My reasoning can be gleaned from the information presented below:
What are the usual Average sensitivities to food and to insulin?
14 grams Carbs=1unit of Insulin.
(Appropriate response if: I eat an extra
14 grams of food, I need one extra
unit of insulin.)
40 mg/dl Blood Glucose=1unit of Insulin.
(Appropriate response if: I take one extra
unit of Insulin, my bG
levels will drop about 40 mg/dl.)
The USUAL range of sensitivities are:
Between 8 and 20 grams Carbs=1unit of Insulin
8 = sensitive to food
20 = insensitive to food
Sensitivity used for KenM's regime: 8
Between 30 and 50 mg/dl Blood Glucose=1unit
of Insulin
30 = insensitive to Insulin
50 = sensitive to Insulin
Sensitivity used for KenM's regime simulaton: 15
If KenM is THAT insensitive (15 mg/dl bg = 1 unit of Insulin) to insulin, and if he uses THAT much Insulin, then either:
a) some of KenM's Humalog is being used by his body as basal (baseline) insulin. (Published information from Eli Lilly says this is impossible!)
... or
b) KenM's physiology is providing an unusual amount of dampening of the insulin/carb interaction.
... or
c) other...???
Any suggestions here?
This regime does fit into the category of "Poor Man's Insulin Pump" because it uses a 24 hour insulin to handle baseline needs, coupled with "short acting insulin with each meal" to handle bolus requirements. However, since 24 hours is a lot longer that one would expect out of NPH, and since KenM apparently has such a low sensitivity to additional insulin, I think I'll reserve the "Poor Man's Pump" space for a later presentation that involves Ultralente and Regular, or Ultralente and Humalog. I'll try to get that presentation up on the DiabetesOnline web site soon. Keep on checking back!
Ken M's FOOD (carbs driving bG levels UP) seems pretty well matched up with INSULIN (driving bG levels DOWN). KenM's body is helping to dampen the expected results. |
Part 2 was meant to be a technical discussion touching on some of the medical algorithms and concepts that ITA uses. Please don't be intimidated by 'LOOKING UNDER THE HOOD!" Please, look at Part 1 to see how easy ITA is to use!
| DiabetesOnline thanks you very much for participating in this TOUR. |
| If you would like to order Insulin Therapy AnalysisTM, please call our toll free sales number: 1-800-820-6084. |